
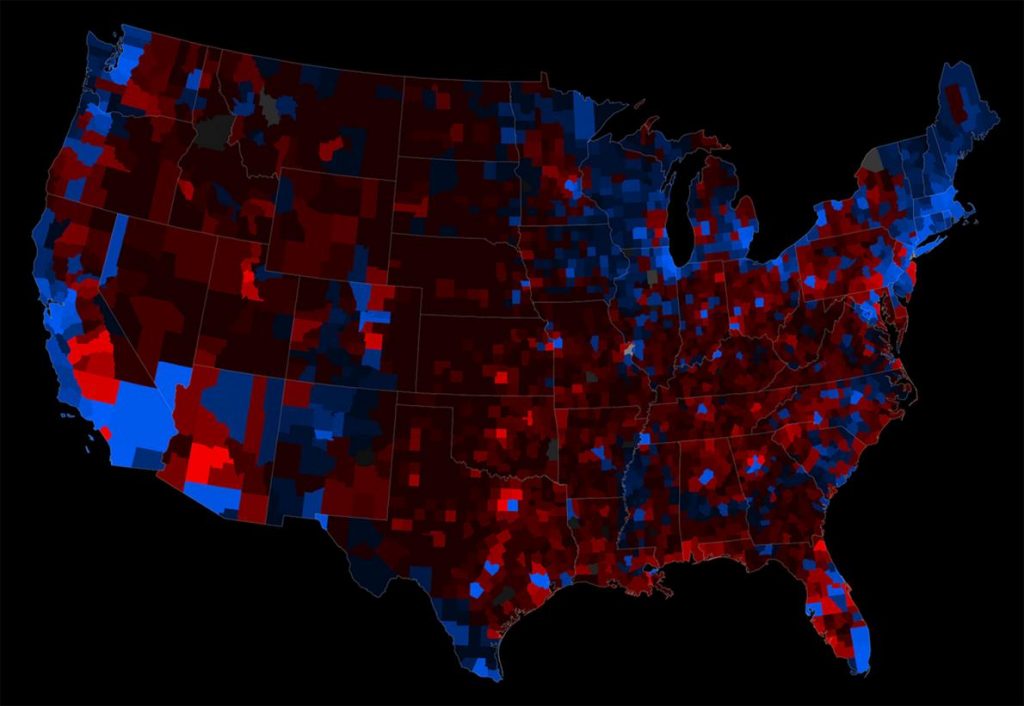
National Geographic has great article about the history of electoral maps. Highlights include the earliest known US electoral map from 1880 and some examples of different approaches to representing population.
Our greatest national map obsession comes every four years. In the weeks leading up to a presidential election, practically every major media outlet creates maps to show the latest polling data. Then, on Election Day, millions of Americans turn on the TV and watch with anticipation (or dread) as maps of the country turn red and blue, one state at a time, in a wave that sweeps from east to west as the vote is tallied.
But despite their persistent presence in news reports, these red-state, blue-state maps are cartographically questionable.

MAP COURTESY ANDY WOODRUFF, AXIS MAPS

MAP COURTESY KEN FIELD, ESRI
The History of Election Maps
Election maps go back more than a century. The work above is the oldest known map of a U.S. presidential election, according to Susan Schulten, a historian of cartography at the University of Denver. Schulten has written extensively about this map, which appeared in a statistical atlas published by the U.S. Census Bureau in 1883. It’s a superb early example of data visualization, Schulten says.
The map depicts results from the 1880 election at the state and county levels, and accompanying bar charts show which states had the biggest turnout and largest margins for one side or the other. The overall color pattern on the map may look familiar but it’s actually the opposite of what’s used today—Democratic areas are red, Republican areas are blue.

MAP COURTESY LIBRARY OF CONGRESS

MAP BY LEON MONTIGNY