
Skip to content
Political Maps

Political Maps

collection of maps of election results and political trends

  • 2016
  • 2012
  • 2008
  • 2004
  • 2000

Voting America: United States Politics 1840-2008

December 31, 2008

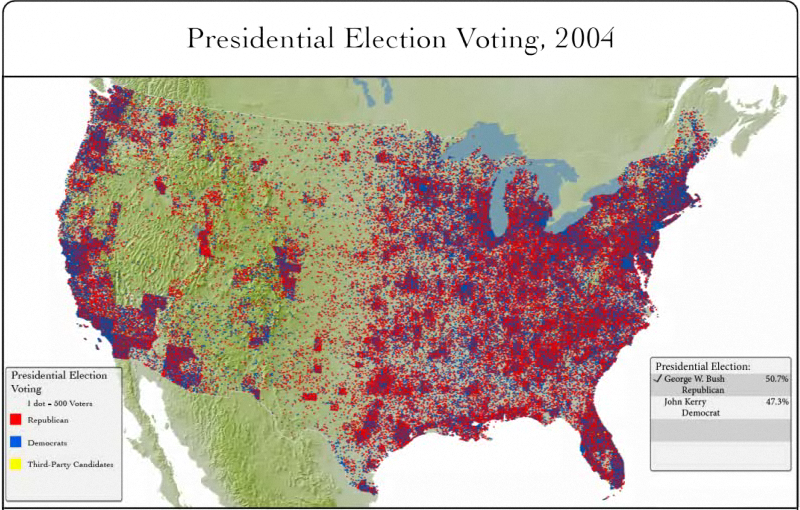
The University of Richmond‘s Digital Scholarship Lab created interactive and cinematic maps of the US presidential elections from 1840 to 2004. The maps provide a geographic time line of US presidential elections.

  • America Voting
  • Election Maps 1840 – 2004
  • Interactive Map
  • Video Commentary Map

Very small sampling of the maps available below…


Post navigation

How the US has voted since 1980: Interactive Map from Google
2000 Presidential Election Maps

Related Post

How Large Is the Divide Between Red and Blue America?

November 5, 2016

After decades of Republican victories, here’s how California became a blue state again

November 3, 2016

AJC: How Georgia went from blue to red

October 18, 2016
Political Maps

Political Maps

collection of maps of election results and political trends

Proudly powered by WordPress | Theme: Newsup by Themeansar.

  • Home
  • About
  • Archives
  • Privacy Policy
  • Sample Page
  • Sitemap